Top 5 BI Tools — Business Intelligence Software Guide
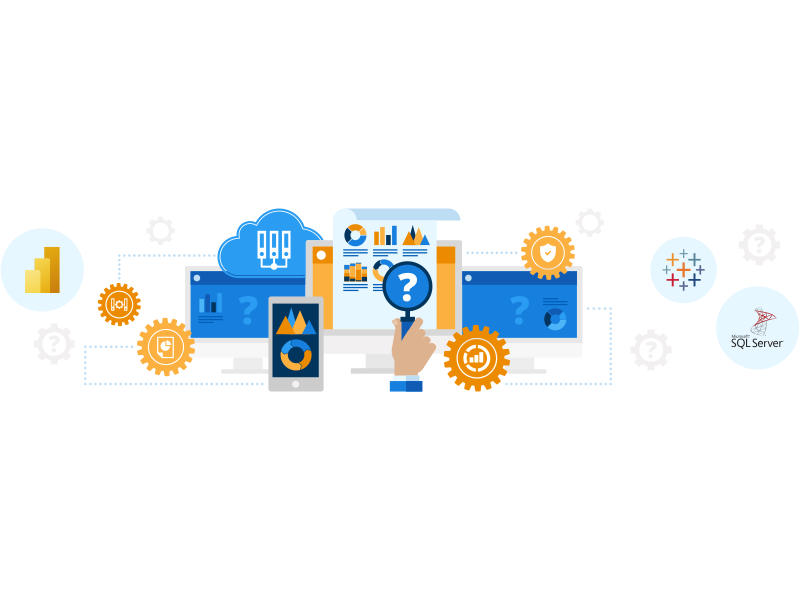
INNERLUXES has guided businesses in picking the right BI platform without the guesswork or wasted spend. With 68 BI projects delivered across 30+ industries, our team knows what makes a rollout pay off — and what quietly drains the budget.
What Are BI Solutions?
Business intelligence solutions pull your scattered data together, clean it up, and turn it into clear answers you can actually act on. The right setup gives you everything you need to move from raw numbers to confident decisions — quickly.
- Connected data sources feeding into a single, trusted view.
- Smart prep powered by AI and safe, role-based access for the right people.
- Easy reporting and visuals that make sense at a glance — whenever you need them.
Features to Look For in a Robust BI Platform
A capable BI platform covers deployment flexibility, data ingestion at scale, and analytics with governance built in. Here is what to look for before you commit.
Deployment & workspaces
- Cloud, on-premises, and hybrid setups.
- Private and shared team spaces.
- Easy sharing across departments.
- Live dashboard collaboration.
- Role-based access for every user.
Data ingestion at scale
- Structured & unstructured inputs.
- Big data pipelines at scale.
- Live streaming data feeds.
- Self-service ingestion.
Analytics, reporting & security
- Click-and-drill dashboards.
- Scheduled and on-demand reports.
- Predictive & AI-driven analytics.
- Row-level security & audit trails.
Top 5 BI Tools on the Market
We’ve worked hands-on with every major BI platform. Here are the five tools we trust most — each with its own strengths, ideal use cases, and pricing model.

Power BI

INNERLUXES recommends
Description
Our top pick year after year for analytics and BI, with the depth to scale without locking you into one vendor.
- Hundreds of ready-made connectors.
- Supports DAX, Power Query, SQL, R, and Python.
- AI modeling via AutoML and Azure ML on premium tiers.
Pricing
Free Desktop, Pro per-user, and Premium dedicated capacity.

Tableau
Description
A long-standing favourite for visual data exploration, with beautiful, interactive dashboards.
- Direct links to dozens of data sources.
- No-code queries and predictive modeling built in.
- Beautiful, interactive dashboards.
Pricing
Creator, Explorer, and Viewer tiers per user, per month.
SQL Server Reporting Services (SSRS)
Description
An on-prem toolset for controlled, pixel-perfect reports across relational, multidimensional, and XML data.
- Routine and on-the-fly reports from relational, multidimensional, and XML data.
- Alerts on key business events.
- Access through browsers, mobile, or email.
Pricing
Bundled with SQL Server licenses (Enterprise, Standard CAL/core/server).

Qlik
Description
Strong AI-led discovery alongside traditional dashboards, with an associative engine for free exploration.
- Wide data connectivity: cloud, on-prem, and big data.
- Associative engine for free exploration.
- Natural language search and suggested insights.
Pricing
Sense Business, Enterprise SaaS, Client-Managed, and QlikView tiers.

MicroStrategy
Description
Built for large enterprises with composable analytics and HyperIntelligence for embedded BI in daily workflows.
- Mixed-source data access with a deep visual library.
- Predictive modeling with R and full mobile analytics.
- HyperIntelligence for embedded BI in daily workflows.
Pricing
Pricing on request — tailored to enterprise scale.
Data ingestion features
- Both structured and unstructured inputs.
- Big data pipelines at scale.
- Day-to-day operational data feeds.
- Quick connection to legacy systems.
- Multi-cloud data pulls.
Data management features
- Self-service prep without coding.
- Ready-to-use ETL pipelines.
- Support for layered data models.
- Automatic data quality checks.
- Smart handling of duplicate records.
Reporting and visualization
- Click-and-drill dashboards.
- Ready-made and custom visuals.
- Reports embedded inside your apps.
- Mobile-friendly views and geo-based insights.
- Story-style narratives and white-labelled reporting.
Analytics features
- Online Analytical Processing (OLAP).
- Pattern discovery through data mining.
- Predictive forecasting models.
- AI and ML-driven insights.
- What-if scenario planning and real-time analysis.
Security features
- Report and workspace-level permissions.
- Row-level access rules.
- Multiple sign-in options and full audit trails.
- Encrypted data at rest and in motion.
- Compliance with GDPR and HIPAA standards.
Real-time & streaming analytics
- Live streaming data feeds.
- Real-time analysis on live data.
- Operational dashboards for time-sensitive decisions.
- Event-driven alerts on key metrics.
- Low-latency query performance.
Predictive & AI analytics
- Predictive forecasting models.
- AI and ML-driven insights.
- AutoML integration on premium tiers.
- Pattern discovery through data mining.
- Suggested insights and anomaly detection.
Embedded & white-labelled BI
- Reports embedded inside your apps.
- White-labelled reporting for clients.
- Consistent branding across dashboards.
- API-based delivery of insights.
- Custom visuals matched to your product.
Mobile & geo analytics
- Mobile-friendly views on every dashboard.
- Maps and geo-based insights.
- Offline access for field teams.
- Push notifications for key alerts.
- Touch-optimised interactions.
Compliance & governance
- Compliance with GDPR and HIPAA standards.
- Full audit trails of user activity.
- Encrypted data at rest and in motion.
- Multiple sign-in options including SSO.
- Centralised governance across departments.
Bring Business Analytics to Your Company with INNERLUXES
Hands-on BI work and 68 projects delivered across 30+ industries, our team knows what makes a BI rollout pay off — and what quietly drains the budget. Our 132+ specialists run every project with clear timelines, honest scoping, and the flexibility to adjust as your needs shift.
Pin down business goals
We identify the real questions your business needs answered before touching any tool — the foundation for every later decision.
Map the right architecture
We map the right architecture for your data — sources, storage, ETL, OLAP, and presentation layers — designed to scale.
Pick the right tech stack
We help you select the BI tool and surrounding stack that fits your team, not the trend — whether that’s Power BI, Tableau, Qlik, or something else.
Data quality & security
We set up data quality rules and security controls from day one — not bolted on later when the system is already in production.
BI rollout planning
We plan a rollout your people will actually use — with training, change management, and a roadmap for scaling across departments.
Honest ROI estimates
We estimate honest ROI before you commit — with realistic cost ranges, value timelines, and risk factors laid out clearly.
BI software tuning
Our team tunes BI software to match your exact workflows, so dashboards and reports feel native to how your business actually works.
Proof of concepts
We build POCs for tricky use cases — so you see real value before signing off on full implementation budgets.
ETL & OLAP integration
We connect your data sources, ETL flows, and OLAP cubes — the unglamorous foundation that makes every dashboard fast and accurate.
Legacy report migration
We migrate legacy reports without breaking history — preserving audit trails and validating output against the old system before cutover.
Training & ongoing support
We train your team, stay on for post-launch support, and optimise performance as data volumes grow — so the system keeps delivering value.

The biggest BI mistake we see? Picking the tool before pinning down the questions. We start every engagement by mapping the real business goals, then choose the platform that fits — Power BI, Tableau, Qlik, or otherwise. That’s how rollouts actually pay off instead of becoming shelfware.
Costs to Implement a BI Solution
Every project is different — your cost depends on the platform you choose, the number of data sources, the complexity of your reports, and how many users need access.
Here are rough starting points to give you a sense of what to expect. These are ballpark figures — your actual quote is scoped individually.
$25,000+
BI consulting and platform selection including architecture mapping and ROI modeling.
$75,000+
Mid-scale BI implementation with ETL, OLAP cubes, and a core set of dashboards.
$180,000+
Enterprise-wide BI rollout with multi-source integration, AI analytics, and full governance.
How You Benefit From BI Implementation with INNERLUXES
From platform selection to post-launch optimisation, we bring the people, processes, and technology that turn scattered data into decisions your business can act on.
Tool-agnostic platform selection
We’re not tied to one vendor. We pick the BI tool that fits your team, budget, and roadmap — not the one with the biggest commission.
Honest scoping & budgets
Clear timelines, realistic cost ranges, and risk factors laid out up front — so you commit with confidence, not surprises.
132+ BI specialists
Deep experience across Power BI, Tableau, SSRS, Qlik, and MicroStrategy — so the right expertise is always in the room.
AI & ML built in
Predictive forecasting, anomaly detection, and AutoML integration — we make advanced analytics practical, not theoretical.
Clear documentation
Every data source, transformation, and report is documented — so handover is clean and your team stays in control of the system long-term.
Compliance from day one
Row-level security, audit trails, and GDPR/HIPAA compliance built into the architecture — not patched on after launch.
Phased rollout, fast wins
Most projects move from proof of concept to first live dashboards in 8–16 weeks — so your team sees value early and momentum builds.
Reliable, scalable performance
Performance tuning as data volumes grow — so dashboards stay fast and queries stay responsive even at enterprise scale.
Data quality controls
Automatic data quality checks, duplicate handling, and validation rules — so the numbers your team trusts are actually trustworthy.
Roadmap for scaling
A clear plan for expanding BI across departments — from finance to operations to sales — without re-architecting every time.
BI Architecture Patterns We Apply
Our architects choose the right structural approach for your BI rollout — based on data volume, latency needs, and how your teams actually consume insights.
Data layer
- Data warehouse and data lake hybrid.
- Lakehouse architecture.
- ETL and ELT pipelines.
- Dimensional modeling (star and snowflake schemas).
- OLAP cubes for fast aggregation.
- Real-time streaming ingestion.
- Master data management (MDM).
- Data mesh and data fabric patterns.
Presentation layer
- Click-and-drill dashboards.
- Embedded BI inside business apps.
- Self-service report builders.
- White-labelled client portals.
- Mobile-first responsive views.
- Story-style data narratives.
Choose Your Service Option
Whether you need answers before committing budget, a fully-managed delivery team, or a refresh of what you already run, pick the engagement that fits where you are.
BI consulting
You need clear answers before committing budget. Our consultants help you pin down goals, pick the right platform, map architecture, and build an honest ROI case.
BI implementation & rollout
Hand the build to a team of 132+ BI specialists who’ve delivered 68 rollouts across 30+ industries. We tune the platform, integrate sources, train your team, and stay on.
BI modernization and support
Your existing BI needs a refresh — or reliable day-to-day care. We migrate legacy reports, optimise performance, and handle ongoing support as your data grows.
To reduce risk before full commitment, INNERLUXES recommends starting with a Proof of Concept. We can deliver a working BI POC in under 6 weeks and scale from there once the value is proven.
BI Solutions – Q&A
Which BI tool does INNERLUXES recommend for most enterprises?
We most often recommend Power BI for enterprises that want depth without locking themselves into one vendor. It offers hundreds of connectors, strong security, and AI-driven modeling — and it scales from a free Desktop edition to Premium dedicated capacity.
How long does a typical BI implementation take?
It depends on scope, but most projects move from proof of concept to first live dashboards within 8–16 weeks. We build in phases — data sources first, then ETL, then OLAP and reporting — so your team sees value early.
Can you migrate our legacy reports without losing history?
Yes. Our team migrates legacy reports without breaking history, preserves audit trails, and validates output against the old system before cutover. You keep continuity and gain modern visualization at the same time.

About INNERLUXES
INNERLUXES is a US LLC · Pvt Ltd software company with 132+ IT professionals, and 68 delivered projects across 30+ industries. Quality and information security management run under robust internal management systems, and our engineers work inside a Chromium enterprise browser we built in-house, so client source code, credentials, and customer data never leave a controlled environment. Learn more about our business intelligence services, our named specialists, and our published client projects.
Let’s discuss your needs
The more detail you share, the more accurate the scope and cost we send back. Free estimate, no sales calls.
Thank you!
Your request has been sent. A senior engineer will reply within one business day with scope, fixed cost and a timeline.